CGM in 3,634 Non-Diabetics Links Diet, Exercise, and Female Hormones to Glucose Variability
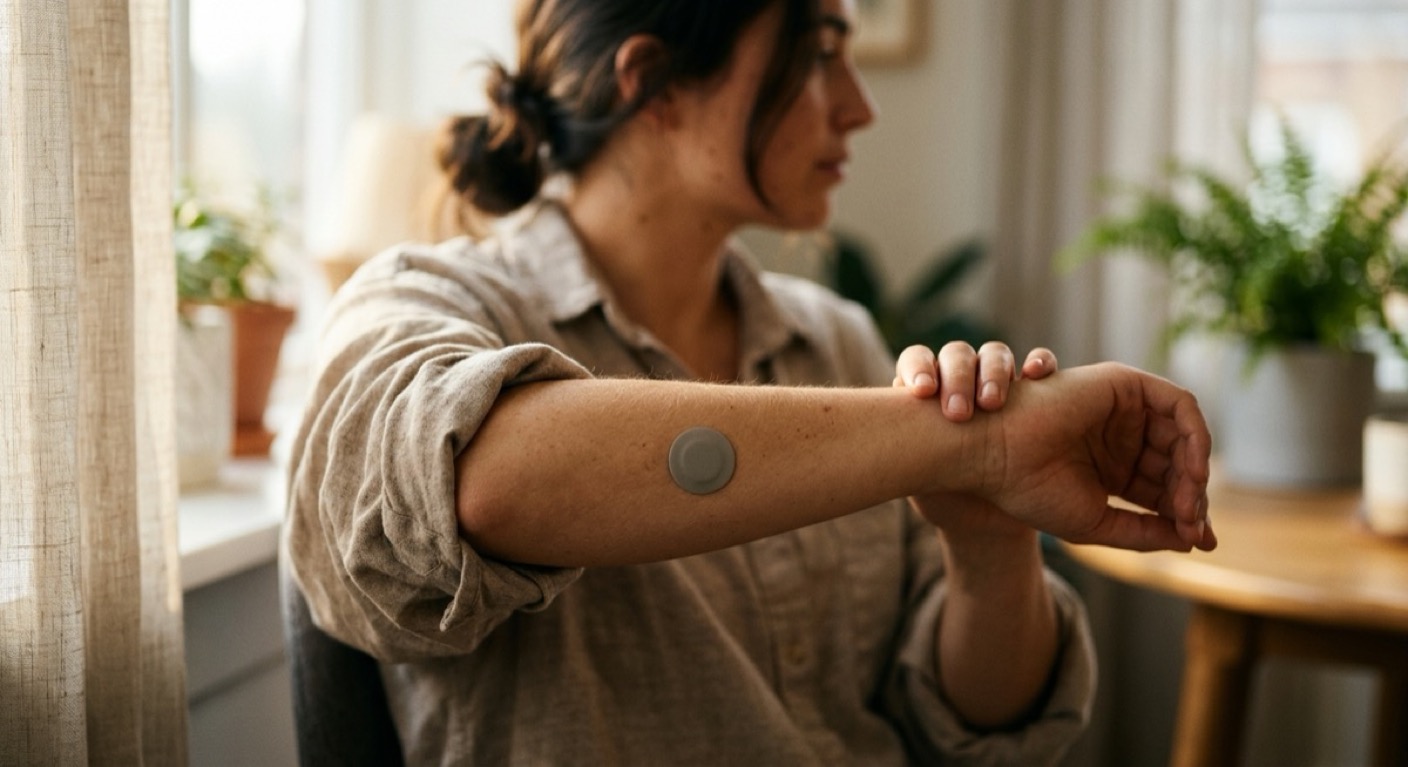
The continuous glucose monitor (CGM) was designed for people managing diabetes. A small sensor patch on the back of the arm reads blood sugar every few minutes, replacing repeated finger pricks with a real-time data stream. In the mid-2020s, that device moved into a new population: people without diabetes, curious about their metabolic health.
A 2026 Nature Communications paper from the PREDICT consortium gives that curiosity its most rigorous data foundation yet. By analyzing CGM readings from 3,634 non-diabetic, non-prediabetic adults, the study maps out how blood glucose behaves in people the clinical system has largely not been watching.
Why People Without Diabetes Started Watching Their Glucose
The connection between glucose dynamics and health extends well beyond diabetes. Blood sugar variability is linked to cognitive performance. Because the brain runs almost entirely on glucose, sharp post-meal spikes followed by rapid drops correlate with afternoon fatigue and difficulty concentrating. Sleep is another vector: larger overnight glucose fluctuations are associated with lower sleep efficiency, which in turn affects appetite regulation the next day.
Skin enters the picture through glycation. Sustained elevated glucose accelerates the cross-linking of collagen fibers, reducing skin elasticity. The relationship between post-meal glucose spikes, sebum production, and inflammatory breakouts is also under investigation. Against this backdrop, the CGM has been repositioned from a diabetes management tool to a metabolic health readout for anyone interested in how their body handles food.
What the PREDICT Cohort Shows
PREDICT (Personal Responses to Dietary Composition Trial) combines data from three study phases. The integrated cohort covers 3,634 participants: 83% women, average age 46, none meeting criteria for diabetes or prediabetes.
The study’s central finding reinforces what smaller PREDICT analyses had already suggested: inter-individual variation in glucose response to identical meals is enormous. Two people eating the same breakfast show meaningfully different CGM curves. Genetics, gut microbiome composition, sleep quality, fitness level, and meal timing all appear to contribute, in proportions that vary by individual.
Meal timing effects emerged as particularly consistent. Evening meals produced larger, longer-lasting glucose spikes than identical meals eaten in the morning. A brief walk after eating, just ten to fifteen minutes, reduced post-meal peaks by an estimated 20 to 30 percent. Poor sleep the night before was associated with elevated glucose variability throughout the following day.
The 87.0% Time in Range Benchmark
In diabetes management, Time in Range (TIR) is the standard CGM metric: the percentage of time blood glucose stays between 70 and 180 mg/dL. A target of 70% or above is the clinical goal for people with diabetes.
Non-diabetics operate in a tighter band. Using a narrower range of 70 to 140 mg/dL as the threshold, Framingham Heart Study auxiliary data incorporated into this analysis found that individuals with normal glycemia spent an average of 87.0% of monitored time within that range.
That 87.0% is one of the first robust population-level benchmarks for healthy adult glucose patterns. It is not, however, a clinical decision threshold. The research team is explicit: in non-diabetic populations, the correlation between CGM metrics and HbA1c, the gold-standard two-to-three month blood sugar average, substantially weakens. This is partly because the glucose range in healthy individuals is narrow enough that CGM variability metrics may not carry the same clinical signal they do in diabetes.
The accompanying meta-analysis, drawing on 23 studies across 11 countries and 1,074 participants, found that CGM users showed significantly lower average glucose levels than controls. Body mass index did not differ between groups. Measurement, it appears, changes behavior more reliably than it changes weight.
The Act of Measuring Changes the Measured
Behavioral science has long documented that when people track a metric, the behavior tied to that metric shifts. This observation applies directly to CGM.
Much of the benefit non-diabetics report from wearing a CGM comes not from the numbers themselves but from the feedback loop the device creates. Seeing that a ten-minute walk after dinner flattens the glucose curve makes that walk feel concrete rather than theoretical. Watching how brown rice and white rice produce different personal responses generates a motivation that general nutrition advice rarely achieves.
The same dynamic cuts the other way. When every post-meal glucose rise is interpreted as a warning, food becomes a source of anxiety. People with existing food restriction tendencies or a history of disordered eating may find that CGM data amplifies rather than resolves that anxiety. The research literature is beginning to flag this as a meaningful concern in the consumer CGM space, particularly given how heavily marketed these devices have become toward weight-conscious populations.
Female Hormones and Glucose Variability
The 83% female composition of the PREDICT cohort makes this the best-powered large study to date for examining menstrual-cycle effects on glucose regulation.
The pattern is real and reproducible. After ovulation, the luteal phase brings rising progesterone, which temporarily reduces insulin sensitivity. The body requires more insulin to move glucose into cells, so the same meal produces a higher, more prolonged glucose response than it would in the follicular phase. In the late luteal phase, the few days immediately before menstruation begins, this effect is compounded: cortisol rises, sleep shallows, appetite shifts toward higher-carbohydrate foods, and glucose variability peaks.
When menstruation begins, the follicular phase commences. As estrogen rises toward ovulation, insulin sensitivity tends to improve and glucose patterns stabilize. For CGM wearers, understanding this cycle means that a week where glucose looks “off” may simply reflect where the body is in its hormonal cycle, not a change in diet adherence or metabolic function.
This context is missing from most consumer CGM apps, which present glucose data without cycle overlay. The PREDICT team’s inclusion of this variable is among the more clinically useful contributions of the 2026 paper.
The Case for Skepticism
Critics of non-diabetic CGM use focus on one core problem: the absence of established interpretation standards. CGM-derived metrics, including Time in Range, coefficient of variation, and mean glucose, have been validated against clinical outcomes in people with diabetes. In non-diabetic populations, those validations do not exist. Clinicians currently have no consensus on what a “concerning” CGM pattern looks like in someone whose HbA1c is 5.2%.
Device accuracy introduces a related issue. CGMs measure glucose in interstitial fluid rather than blood directly, creating a five-to-fifteen minute lag. During rapid glucose changes, such as intense exercise, the gap between CGM readings and actual blood glucose can exceed device specifications. Current generation sensors from major manufacturers have improved markedly, but in the narrow glucose ranges typical of non-diabetics, even small absolute errors represent a larger relative uncertainty.
The research team’s position is measured: this study is in the data-collection phase. What clinicians should do with these patterns in non-diabetic patients remains an open question.
Who This Makes Sense For, and Who Should Pause
A short CGM trial, two to four weeks, may offer genuine signal for someone with a family history of type 2 diabetes who wants to understand their metabolic baseline before clinical markers shift. Athletes wanting to understand how training load and meal timing interact on their glucose response have used CGM to meaningful effect. Anyone considering a significant dietary intervention has the option to measure their actual response rather than rely on population averages.
The clearer counterindication is a person with existing food anxiety, disordered eating history, or a tendency toward health monitoring that increases rather than reduces distress. In those cases, CGM data tends to feed restriction rather than inform it.
The PREDICT dataset’s most durable contribution may be calibrating expectations. Healthy people see glucose variability that looks alarming if you don’t know it’s normal. Seeing the 87.0% Time in Range figure in context, knowing that the other 13% includes the body’s ordinary response to real food eaten in real life, is a more accurate frame than the one most consumer CGM platforms currently provide.
Q. Is it worth wearing a CGM if I don’t have diabetes?
If you have a family history of type 2 diabetes or notice significant energy dips after meals, a two-to-four week CGM trial can help you identify your personal glucose response patterns. Because clinical interpretation thresholds for non-diabetics are still being established, focusing on recurring patterns rather than individual numbers is the more practical approach.
Q. Is a glucose spike after meals something to be concerned about?
Not necessarily. PREDICT data shows that even in healthy individuals, blood glucose rises and falls after eating. The key is not the spike itself but how high it goes, how long it stays elevated, and whether the pattern is consistently triggered by specific foods or meal timing.
Q. My glucose seems less stable before my period. Is that real?
It’s real. During the luteal phase after ovulation, rising progesterone temporarily increases insulin resistance, meaning the same meal can produce a larger glucose response. Late luteal phase, the few days before menstruation, tends to show the highest variability. The PREDICT cohort (83% women) captured this pattern.